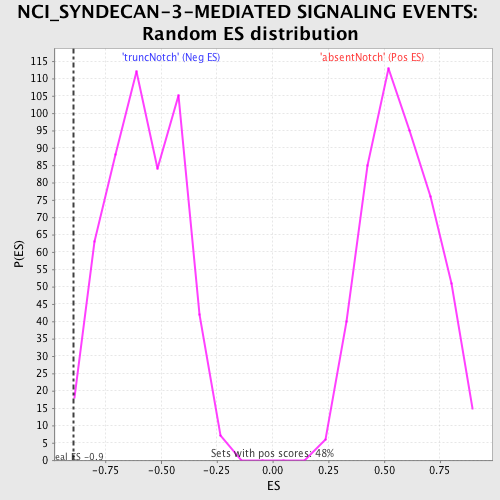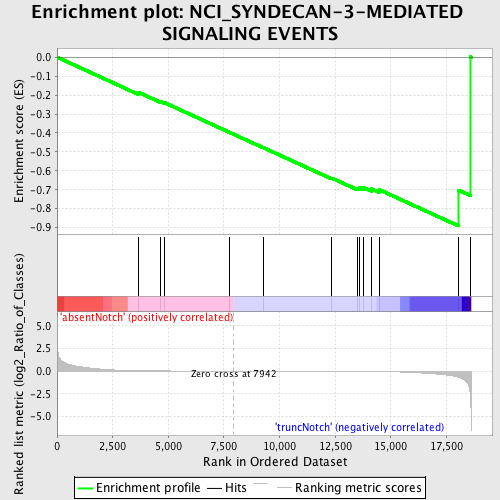
Profile of the Running ES Score & Positions of GeneSet Members on the Rank Ordered List
| Dataset | Set_03_absentNotch_versus_truncNotch.phenotype_absentNotch_versus_truncNotch.cls #absentNotch_versus_truncNotch.phenotype_absentNotch_versus_truncNotch.cls #absentNotch_versus_truncNotch_repos |
| Phenotype | phenotype_absentNotch_versus_truncNotch.cls#absentNotch_versus_truncNotch_repos |
| Upregulated in class | truncNotch |
| GeneSet | NCI_SYNDECAN-3-MEDIATED SIGNALING EVENTS |
| Enrichment Score (ES) | -0.8911448 |
| Normalized Enrichment Score (NES) | -1.5488576 |
| Nominal p-value | 0.011560693 |
| FDR q-value | 0.3370574 |
| FWER p-Value | 0.948 |
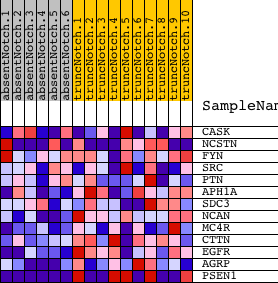
| PROBE | DESCRIPTION (from dataset) | GENE SYMBOL | GENE_TITLE | RANK IN GENE LIST | RANK METRIC SCORE | RUNNING ES | CORE ENRICHMENT | |
|---|---|---|---|---|---|---|---|---|
| 1 | CASK | 2340215 3290576 6770215 | 3677 | 0.041 | -0.1863 | No | ||
| 2 | NCSTN | 940601 6400594 | 4664 | 0.015 | -0.2351 | No | ||
| 3 | FYN | 2100468 4760520 4850687 | 4821 | 0.014 | -0.2397 | No | ||
| 4 | SRC | 580132 | 7739 | 0.001 | -0.3963 | No | ||
| 5 | PTN | 5910161 | 9282 | -0.003 | -0.4783 | No | ||
| 6 | APH1A | 4060273 4670465 6450711 | 12343 | -0.017 | -0.6381 | No | ||
| 7 | SDC3 | 460706 | 13481 | -0.029 | -0.6910 | No | ||
| 8 | NCAN | 1450400 3870239 4590440 6350438 7040332 | 13606 | -0.032 | -0.6889 | No | ||
| 9 | MC4R | 430333 | 13779 | -0.035 | -0.6884 | No | ||
| 10 | CTTN | 780154 1690538 3310017 4060717 | 14133 | -0.042 | -0.6956 | No | ||
| 11 | EGFR | 4920138 6480521 | 14489 | -0.052 | -0.7001 | No | ||
| 12 | AGRP | 1990082 | 18044 | -0.679 | -0.7018 | Yes | ||
| 13 | PSEN1 | 130403 2030647 6100603 | 18581 | -2.626 | 0.0019 | Yes |